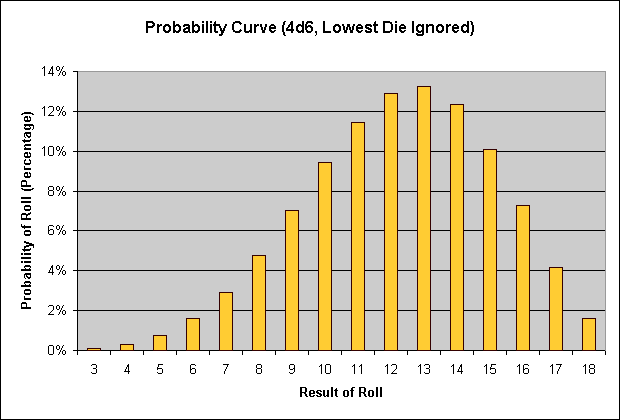
D&D and AD&D players have been predominantly using the ability-score generation method of "roll 4d6, drop the lowest die" ever since the AD&D 1st Edition Dungeon Master's Guide specified it as "Method I" in 1979. However, I've never seen a graph of the probability curve for this method, so I figured I'd create one and present it below.

For good measure, in case someone needs the exact numbers involved, I've included those on the following table:
| Result | 3 | 4 | 5 | 6 | 7 | 8 | 9 | 10 | 11 | 12 | 13 | 14 | 15 | 16 | 17 | 18 | Total |
| Count | 1 | 4 | 10 | 21 | 38 | 62 | 91 | 122 | 148 | 167 | 172 | 160 | 131 | 94 | 54 | 21 | 1,296 |
| Percent | 0% | 0% | 1% | 2% | 3% | 5% | 7% | 9% | 11% | 13% | 13% | 12% | 10% | 7% | 4% | 2% | 100% |